The flowchart depicts the flow of control in program modules. Using a flowchart algorithm can be better understood as it is a pictorial representation of the algorithm. The flowchart provides you the sequential flow of the program.
The pictorial representation is developed using pictures of boxes and arrows of different shapes and sizes. Using this pictorial representation solution to a given problem can be better understood. The use of flowcharts is many like it is used for documentation purposes, it is used for analyzing the problem, it is used for designing of the solution to a given problem and depicting possible outcomes of used decision statements in the program.
To analyze the flow of processes and inter-process communication, flowcharts are used. The flowchart depicts how program execution will take place in the program. A well-developed flowchart reduces the probability of generating errors in the program at run time. The boxes used in the program have different shapes and sizes and have their own significance.
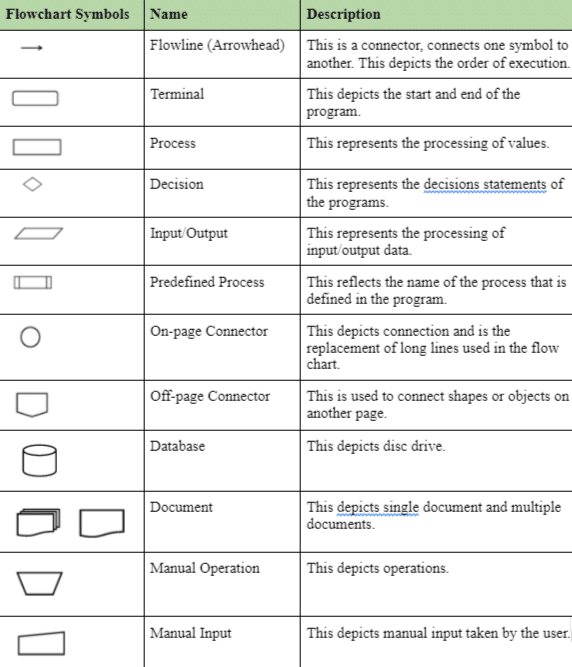
Different boxes and arrows used in the flowchart with their name and significance are given below:

A program has a different organizational unit and these units are depicted by flow charts. A particular symbol used in a flow chart depicts a particular organizational unit in the program. A flowchart is used to project a particular organizational unit in the program that performs a specific task.
The Flowchart is also known as the process map. This is used to analyze and understand the algorithms. There exist four types of flowcharts:
- Document flowcharts, this is used to reflect the flow of a document in a system.
- Data flowcharts reflect the flow of data in a particular system.
- System flowcharts depict the control either at the physical level or at the resource level.
- Program flowchart depicts a set of controls used in a particular program in a particular system.
The flowchart can be created using an application program capable of creating closed shapes. A few of the tools that can be used to create a flowchart include – Flowgorithm, Visual Logic, VisiRule, etc.
The flowchart is an essential part of programming, perhaps before program instructions are written flow chart is created. Before programming instructions are written algorithm is designed. This algorithm is pictorially represented using a flowchart. Thus it can be said that a flowchart is a high-level diagram of the solution of a given problem that will be implemented on a mechanical device. Creatin a well-defined flowchart is an art that improves as it is worked on. A programmer unable to read a flowchart can not do problem analysis or find a particular solution to the problem.
Flowcharts are platform-independent and have the ability to depict the programming principles. Using flowcharts a programmer can express ideas. Flowcharts are independents of the programs developed. The Flowchart works as a tool used by programmers to understand already developed programs. The flowchart is also used to debug a program and if required modify it.
The flowchart helps in understanding the conceptual model of the computer program and its related operations. The flowchart assists in composting programs. The flowcharts are not program-specific. Flowchart work as an aid to non-technical persons to understand sequential procedures that have to be followed to accomplish a particular task. Thus flowcharts help in understanding the decision criterion, flowcharts projects the relation that exists in the program, using flowchart relevant and irrelevant flow in the program can be projected, and flowchart helps in reducing information bulk.
The flowchart can also enclose information related to cost, time and distance. In research studies, it was found that a flowchart is most useful in debugging. The flowcharts are not able to highlight errors that exist in the program.
Managers and nonprogrammers consider flowcharts to be more useful than programming language constructs. Managers and nonprogrammers require less time to understand the program logic when they use flowcharts. Flowcharts reduce anxiety and confusion in understanding large programs. The flowchart helps in developing a deeper understanding of complex programs and cognitive tasks. The flowchart depicts the internal semantics of the program and it is not just the alternative representation of the computer programs.
Flowcharts are the semantic models of programs. But if the program undergoes change regularly then it becomes quite expensive and time-consuming in creating flowcharts again and again. The flow chart can be creative or expository. Creative flow charts are used by programmers to align thoughts at the beginning of the programming and an Expository flowchart is used to explain the developed algorithm to someone else. Creating a flowchart is a time-consuming process and needs a lot of time.
A flow-outline is different from a flowchart. A flow-outline is a sequential procedure developed using the normal English language. In the flow-outline, each step of the sequential procedure is numbered or given a label. The flow-outline is one dimensional and the flowchart has two dimensions. Flowcharts are more easily understood by both technical and non-technical persons both. To be effective flow outlines and flowcharts have to be used together.
Program documentation is done by using three constructs, first, by using formal language, second, by using flow outline, and third, by using a flow chart. These three constructs are used depending on the type of documentation to be done. The flowchart is used at the third level.
Different approaches are used to document programs the most used approach is writing documentation and adding it to the program. Writing theoretical documentation reduces the labor of creating a flow chart.
Expository flow charts are used instead of creative flow charts.


Leave a Reply